一、ELK 简介
ELK 是三个开源软件的缩写,分别为:Elasticsearch 、 Logstash 以及 Kibana , 它们都是开源软件。不过现在还新增了一个 Beats,它是一个轻量级的日志收集处理工具(Agent),Beats 占用资源少,适合于在各个服务器上搜集日志后传输给 Logstash,官方也推荐此工具,目前由于原本的 ELK Stack 成员中加入了 Beats 工具所以已改名为 Elastic Stack。
Elastic Stack 包含:
Elasticsearch 是个开源分布式搜索引擎,提供搜集、分析、存储数据三大功能。它的特点有:分布式,零配置,自动发现,索引自动分片,索引副本机制,restful 风格接口,多数据源,自动搜索负载等。
Logstash 主要是用来日志的搜集、分析、过滤日志的工具,支持大量的数据获取方式。一般工作方式为 c/s 架构,client 端安装在需要收集日志的主机上,server 端负责将收到的各节点日志进行过滤、修改等操作在一并发往 elasticsearch 上去。
Kibana 也是一个开源和免费的工具,Kibana 可以为 Logstash 和 ElasticSearch 提供的日志分析友好的 Web 界面,可以帮助汇总、分析和搜索重要数据日志。
Beats 在这里是一个轻量级日志采集器,其实 Beats 家族有 6 个成员,早期的 ELK 架构中使用 Logstash 收集、解析日志,但是 Logstash 对内存、cpu、io 等资源消耗比较高。相比 Logstash,Beats 所占系统的 CPU 和内存几乎可以忽略不计
ELK Stack (5.0 版本之后)–> Elastic Stack == (ELK Stack + Beats)。目前 Beats 包含六种工具:
Packetbeat: 网络数据(收集网络流量数据)
Metricbeat: 指标 (收集系统、进程和文件系统级别的 CPU 和内存使用情况等数据)
Winlogbeat: windows 事件日志(收集 Windows 事件日志数据)
Auditbeat:审计数据 (收集审计日志)
Heartbeat:运行时间监控 (收集系统运行时的数据)
1、ELK 架构图

2、环境准备
操作系统:CentOS 7.8.2003 (Core)
服务器 IP:192.168.10.10
3、软件版本
elasticsearch:elasticsearch-7.17.23-linux-x86_64.tar.gz
kibana:kibana-7.17.23-linux-x86_64.tar.gz
logstash:logstash-7.17.23.tar.gz
filebeat:filebeat-7.17.23-linux-x86_64.tar.gz
JDK:jdk-11.0.19_linux-x64_bin.tar.gz
Redis:redis-5.0.9.tar.gz
Nginx:nginx-1.27.0.tar.gz
二、基础环境配置
1、关闭防火墙和 selinux
[root@localhost ~]# systemctl stop firewalld
[root@localhost ~]# systemctl disable firewalld
[root@localhost ~]# setenforce 0
[root@localhost ~]# sed -i ‘/SELINUX/s/enforcing/disabled/’ /etc/selinux/config
2、内核优化
[root@localhost ~]# vim /etc/security/limits.conf
# 在文件最后添加以下内容
* soft nofile 65537
* hard nofile 65537
* soft nproc 65537
* hard nproc 65537
[root@localhost ~]# vim /etc/security/limits.d/20-nproc.conf
# 配置以下内容
* soft nproc 4096
[root@localhost ~]# vim /etc/sysctl.conf
# 配置以下内容
net.ipv4.tcp_max_syn_backlog = 65536
net.core.netdev_max_backlog = 32768
net.core.somaxconn = 32768
net.core.wmem_default = 8388608
net.core.rmem_default = 8388608
net.core.rmem_max = 16777216
net.core.wmem_max = 16777216
net.ipv4.tcp_timestamps = 0
net.ipv4.tcp_synack_retries = 2
net.ipv4.tcp_syn_retries = 2
net.ipv4.tcp_tw_recycle = 1
net.ipv4.tcp_tw_reuse = 1
net.ipv4.tcp_mem = 94500000 915000000 927000000
net.ipv4.tcp_max_orphans = 3276800
net.ipv4.tcp_fin_timeout = 120
net.ipv4.tcp_keepalive_time = 120
net.ipv4.ip_local_port_range = 1024 65535
net.ipv4.tcp_max_tw_buckets = 30000
fs.file-max=655350
vm.max_map_count = 262144
net.core.somaxconn= 65535
net.ipv4.ip_forward = 1
net.ipv6.conf.all.disable_ipv6=1
#执行 sysctl -p 使其生效
[root@localhost ~]# sysctl –p
3、安装 JDK 环境
[root@localhost ~]# wget https://y.cdn.iwmyx.cn/soft/jdk-11.0.19_linux-x64_bin.tar.gz
[root@localhost ~]# tar zxf jdk-11.0.19_linux-x64_bin.tar.gz -C /usr/local
#配置/etc/profile,添加以下内容
[root@localhost ~]# vim /etc/profile
export JAVA_HOME=/usr/local/jdk-11.0.19
export CLASSPATH=$CLASSPATH:$JAVA_HOME/lib:$JAVA_HOME/jre/lib
export PATH=$JAVA_HOME/bin:$JAVA_HOME/jre/bin:$PATH:$HOMR/bin
[root@localhost ~]# source /etc/profile
#看到如下信息,java 环境配置成功
[root@localhost ~]# java -version
java version “11.0.19” 2023-04-18 LTS
Java(TM) SE Runtime Environment 18.9 (build 11.0.19+9-LTS-224)
Java HotSpot(TM) 64-Bit Server VM 18.9 (build 11.0.19+9-LTS-224, mixed mode)
4、创建 ELK 用户
[root@localhost ~]# useradd elk
三、安装 Redis
1、下载 Redis 包
[root@localhost ]# wget -c http://download.redis.io/releases/redis-5.0.9.tar.gz
2、解压安装配置 Redis
[root@localhost ]# tar zxf redis-5.0.9.tar.gz
[root@localhost ]# mv redis-5.0.9 /usr/local/redis
[root@localhost ]# cd /usr/local/redis/
[root@localhost ]# make
[root@localhost redis]# mkdir -p /data/redis
# 随机生成密码
[root@localhost redis]# openssl rand -hex 12
c710403c3c97ac97a269d7a6
[root@localhost redis]# ln -sf /usr/local/redis/src/redis-* /usr/bin
[root@localhost redis]# sed -i “s/127.0.0.1/0.0.0.0/g” /usr/local/redis/redis.conf
[root@localhost redis]# sed -i “/daemonize/s/no/yes/” /usr/local/redis/redis.conf
[root@localhost redis]# sed -i “s/dir .*/dir \/data\/redis/” /usr/local/redis/redis.conf
[root@localhost redis]# sed -i “s/logfile .*/logfile \/usr\/local\/redis\/redis.log/” /usr/local/redis/redis.conf
[root@localhost redis]# sed -i ‘/appendonly/s/no/yes/’ /usr/local/redis/redis.conf
[root@localhost redis]# sed -i “s/# requirepass foobared/requirepass c710403c3c97ac97a269d7a6/” /usr/local/redis/redis.conf
[root@localhost redis]# echo never > /sys/kernel/mm/transparent_hugepage/enabled
[root@localhost redis]# sysctl vm.overcommit_memory=1
5、创建 systemctl 管理配置文件
[root@localhost redis]# vim /usr/lib/systemd/system/redis.service
# 配置内容如下
[Unit]
Description=Redis Server
After=network-online.target remote-fs.target nss-lookup.target
Wants=network-online.target
[Service]
Type=forking
ExecStart=/usr/bin/redis-server /usr/local/redis/redis.conf
ExecStop=/usr/bin/redis-cli -h 127.0.0.1 -p 6379 shutdown
User=root
Group=root
[Install]
WantedBy=multi-user.target
6)启动 Redis 服务
[root@localhost redis]# systemctl daemon-reload
[root@localhost redis]# systemctl enable redis
[root@localhost redis]# systemctl start redis
7)查询端口及进程
[root@localhost redis]# netstat -lntup |grep 6379
[root@localhost redis]# systemctl status redis
四、安装 elasticsearch
1、创建持久化目录及 Logs 日志目录
[root@localhost ~]# mkdir -p /data/elasticsearch/{data,logs}
2、下载 elasticsearch 软件包
[root@localhost ~]# wget https://artifacts.elastic.co/downloads/elasticsearch/elasticsearch-7.17.23-linux-x86_64.tar.gz
3、解压并重命名
[root@localhost ~]# tar xf elasticsearch-7.17.23-linux-x86_64.tar.gz
[root@localhost ~]# mv elasticsearch-7.17.23 /usr/local/elasticsearch
4、修改 elasticsearch.yml 配置文件,文件内容如下
[root@localhost ~]# vim /usr/local/elasticsearch/config/elasticsearch.yml
# 集群名称
cluster.name: es-nginx-elk
# 节点名称
node.name: es-master
# 存放数据目录,先创建该目录
path.data: /data/elasticsearch/data
# 存放日志目录,先创建该目录
path.logs: /data/elasticsearch/logs
# 节点 IP
network.host: 0.0.0.0
# tcp 端口
transport.tcp.port: 9300
# http 端口
http.port: 9200
# 主合格节点列表,若有多个主节点,则主节点进行对应的配置
cluster.initial_master_nodes: ["es-master"]
# 发现节点(不设置会出现发布不了节点 )
discovery.seed_hosts: ["192.168.10.10:9300"]
# 是否允许作为主节点
node.master: true
# 是否保存数据
node.data: true
node.ingest: false
node.ml: false
cluster.remote.connect: false
# 跨域
http.cors.enabled: true
http.cors.allow-origin: "*"
# 配置 X-Pack
http.cors.allow-headers: Authorization
xpack.security.enabled: true
xpack.security.transport.ssl.enabled: true
5、ELK 用户授权
[root@localhost ~]# chown -R elk.elk /usr/local/elasticsearch/
[root@localhost ~]# chown -R elk.elk /data/elasticsearch/*
6、启动 elasticsearch 服务(第一次先测试好然后再加-d 后台启动)
[root@localhost ~]# su – elk
[elk@localhost ~]$ /usr/local/elasticsearch/bin/elasticsearch
7、后台启动 elasticsearch 服务
[elk@localhost ~]$ /usr/local/elasticsearch/bin/elasticsearch -d
8、查询 ES 的集群状态
[elk@localhost ~]$ curl -X GET ‘http://192.168.10.10:9200/_cluster/health?pretty’
{
“cluster_name” : “elasticsearch”,
“status” : “green”,
“timed_out” : false,
“number_of_nodes” : 1,
“number_of_data_nodes” : 1,
“active_primary_shards” : 1,
“active_shards” : 1,
“relocating_shards” : 0,
“initializing_shards” : 0,
“unassigned_shards” : 0,
“delayed_unassigned_shards” : 0,
“number_of_pending_tasks” : 0,
“number_of_in_flight_fetch” : 0,
“task_max_waiting_in_queue_millis” : 0,
“active_shards_percent_as_number” : 100.0
}
# status=green 表示服务正常
9、ElasticSearch 配置用户名密码
[elk@localhost ~]$ /usr/local/elasticsearch/bin/elasticsearch-setup-passwords interactive
注:这里为了方便演示,密码统一设置为 esuserpassword

注:配置了密码之后获取集群状态命令如下
[elk@localhost ~]$ curl –user elastic:esuserpassword -X GET ‘http://192.168.10.10:9200/_cluster/health?pretty’

10、Elasticsearch 常用命令
curl -XDELETE ‘http://192.168.10.10:9200/logstash-*’ 删除索引(后面为索引名称)
curl -XGET ‘192.168.10.10:9200/_cat/health?v&pretty’ 查看集群状态
curl -XGET ‘192.168.10.10:9200/_cat/indices?v&pretty’ 查看索引
五、安装 Kibana
1、下载 Kibana 软件包
[root@localhost ~]$ wget https://artifacts.elastic.co/downloads/kibana/kibana-7.17.23-linux-x86_64.tar.gz
2、解压 Kibana 软件包并重命名
[root@localhost ~]$ tar xf kibana-7.17.23-linux-x86_64.tar.gz
[root@localhost ~]$ mv kibana-7.17.23-linux-x86_64 /usr/local/kibana
3、配置 Kibana 配置文件
[root@localhost ~]$ vim /usr/local/kibana/config/kibana.yml
#配置内容如下
# 配置 kibana 的端口
server.port: 5601
# 配置监听 ip
server.host: "192.168.10.10"
# 配置 es 服务器的 ip,如果是集群则配置该集群中主节点的 ip
elasticsearch.hosts: ["http://192.168.10.10:9200"]
elasticsearch.username: "elastic"
elasticsearch.password: "ElkPassword"
# 配置 kibana 的日志文件路径,不然默认是 messages 里记录日志
logging.dest: /usr/local/kibana/logs/kibana.log
# 配置为中文
i18n.locale: "zh-CN"
4、创建日志目录并授权
[root@localhost ~]# mkdir /usr/local/kibana/logs
[root@localhost ~]# chown -R elk.elk /usr/local/kibana/
5、启动 Kibana 服务
[root@localhost ~]# su – elk
# 前台启动
[elk@localhost ~]$ /usr/local/kibana/bin/kibana
# 后台启动
[elk@localhost ~]$ /usr/local/kibana/bin/kibana &
温馨提示:可以先前台启动查看日志,正常之后在后台启动。
六、安装 Nginx
1)安装依赖软件
[root@localhost ~]# yum -y install make zlib zlib-devel gcc-c++ libtool pcre pcre-devel openssl openssl-devel wget
2)下载 Nginx 源码包
[root@localhost ~]# wget -c http://nginx.org/download/nginx-1.27.0.tar.gz
3)解压 Nginx 源码包
[root@localhost ~]# tar zxf nginx-1.27.0.tar.gz
4)进入解压目录,预编译 Nginx
[root@localhost ~]# cd nginx-1.27.0
[root@localhost ~]# useradd -s /sbin/nologin www
[root@localhost ~]# ./configure –prefix=/usr/local/nginx –user=www –group=www –with-http_ssl_module –with-http_stub_status_module –with-stream
5)编译和安装 Nginx
[root@localhost ~]# make && make install
6)检测配置或安装是否成功:
[root@localhost nginx-1.27.0]# /usr/local/nginx/sbin/nginx -t
如果出现下列信息,则表示安装或配置成功。
nginx: the configuration file /usr/local/nginx/conf/nginx.conf syntax is ok
nginx: configuration file /usr/local/nginx/conf/nginx.conf test is successful
7)配置 nginx.conf
[root@localhost ~]# vim /usr/local/nginx/conf/nginx.conf
	user www www;
	worker_processes auto;
	pid /usr/local/nginx/logs/nginx.pid;
events {
	use epoll;
	worker_connections 10240;
	multi_accept on;
	}
http	{
	include       mime.types;
	default_type  application/octet-stream;
	log_format json '{"@timestamp":"$time_iso8601",'
			'"host":"$server_addr",'
			'"clientip":"$remote_addr",'
			'"remote_user":"$remote_user",'
			'"request":"$request",'
			'"http_user_agent":"$http_user_agent",'
			'"size":$body_bytes_sent,'
			'"responsetime":$request_time,'
			'"upstreamtime":"$upstream_response_time",'
			'"upstreamhost":"$upstream_addr",'
			'"http_host":"$host",'
			'"requesturi":"$request_uri",'
			'"url":"$uri",'
			'"domain":"$host",'
			'"xff":"$http_x_forwarded_for",'
			'"referer":"$http_referer",'
			'"status":"$status"}';
	access_log logs/access.log json;
	error_log logs/error.log warn;
	sendfile        on;
	tcp_nopush          on;
	keepalive_timeout  120;
	tcp_nodelay         on;
	server_tokens off;
	gzip    on;
	gzip_min_length 1k;
	gzip_buffers    4 64k;
	gzip_http_version 1.1;
	gzip_comp_level 4;
	gzip_types      text/plain application/x-javascript text/css application/xml;
	gzip_vary       on;
	client_max_body_size 10m;
	client_body_buffer_size 128k;
	proxy_connect_timeout 90;
	proxy_send_timeout 90;
	proxy_buffer_size 4k;
	proxy_buffers 4 32k;
	proxy_busy_buffers_size 64k;
	large_client_header_buffers 4 4k;
	client_header_buffer_size 4k;
	open_file_cache_valid 30s;
	open_file_cache_min_uses 1;
server {
	listen	80;
	server_name	localhost;
	location / {
	proxy_pass   http://192.168.10.10:5601;
	proxy_set_header   Host             $host;
	proxy_set_header   X-Real-IP        $remote_addr;
	proxy_set_header   X-Forwarded-For  $proxy_add_x_forwarded_for;
	}
  }
}
8)创建 systemctl 管理配置文件
[root@localhost ~]# vim /usr/lib/systemd/system/nginx.service
[Unit]
Description=Nginx Server
Documentation=http://nginx.org/en/docs/
After=network-online.target remote-fs.target nss-lookup.target
Wants=network-online.target
[Service]
Type=forking
PIDFile=/usr/local/nginx/logs/nginx.pid
ExecStart=/usr/local/nginx/sbin/nginx -c /usr/local/nginx/conf/nginx.conf
ExecReload=/bin/kill -s HUP $MAINPID
ExecStop=/bin/kill -s TERM $MAINPID
[Install]
WantedBy=multi-user.target
9)启动 Nginx 服务
[root@localhost ~]# systemctl daemon-reload
[root@localhost ~]# systemctl enable nginx
[root@localhost ~]# systemctl start nginx
七、安装 filebeat
1、下载 filebeat 软件包
[root@localhost ~]# wget https://artifacts.elastic.co/downloads/beats/filebeat/filebeat-7.17.23-linux-x86_64.tar.gz
2、解压并重命名
[root@localhost ~]# tar xf filebeat-7.17.23-linux-x86_64.tar.gz
[root@localhost ~]# mv filebeat-7.17.23-linux-x86_64 /usr/local/filebeat
3、编辑 filebeat.yml 配置文件,配置内容如下
[root@localhost ~]# vim /usr/local/filebeat/filebeat.yml
#========= Filebeat inputs ==========
filebeat.inputs:
- type: log
  enabled: true
  paths:
    - /usr/local/nginx/logs/access.log
  multiline:
      pattern: '^\d{4}-\d{1,2}-\d{1,2}\s\d{1,2}:\d{1,2}:\d{1,2}'
      negate: true
      match: after
  fields:
    logtype: nginx_access
- type: log
  enabled: true
  paths:
    - /usr/local/nginx/logs/error.log
  multiline:
      pattern: '^\d{4}-\d{1,2}-\d{1,2}\s\d{1,2}:\d{1,2}:\d{1,2}'
      negate: true
      match: after
  fields:
    logtype: nginx_error
output.redis:
  enabled: true
  hosts: ["192.168.10.10:6379"]
  password: "c710403c3c97ac97a269d7a6"
  key: "all-access-log"
  db: 0
  timeout: 10
4、创建 Filebeat 日志目录
[root@localhost ~]# mkdir /usr/local/filebeat/logs
[root@localhost ~]# chown -R elk.elk /usr/local/filebeat
5、启动 filebeat 服务
[root@localhost ~]# su – elk
[elk@localhost ~]# cd /usr/local/filebeat
# 前台启动
[elk@localhost filebeat]$ ./filebeat -e -c filebeat.yml >>logs/filebeat.log
# 后台启动
[elk@localhost filebeat]$ nohup ./filebeat -e -c filebeat.yml >>logs/filebeat.log >/dev/null 2>&1 &
八、安装 logstash
1、下载软件包
[root@localhost ~]# wget https://artifacts.elastic.co/downloads/logstash/logstash-7.17.23.tar.gz
2、解压并重命名
[root@localhost ~]# tar zxf logstash-7.17.23.tar.gz
[root@localhost ~]# mv logstash-7.17.23 /usr/local/logstash
3、创建 nginx.conf 文件,添加以下内容
[root@localhost ~]# vim /usr/local/logstash/config/nginx.conf
input {
    redis {
        host => "192.168.10.10"
        port => "6379"
        db => "0"
        password => "c710403c3c97ac97a269d7a6"
        data_type => "list"
        key => "all-access-log"
        codec => json
    }
}
filter {
if [fields][logtype] == "nginx_access" {
        json {
            source => "message"
        }

        grok {
            match => { "message" => "%{TIMESTAMP_ISO8601:timestamp} %{LOGLEVEL:level}" }
        }

        date {
            match => ["timestamp", "yyyy-MM-dd HH:mm:ss,SSS"]
            target => "@timestamp"
        }
    }
if [fields][logtype] == "nginx_error" {
        json {
            source => "message"
        }

        grok {
            match => { "message" => "%{TIMESTAMP_ISO8601:timestamp} %{LOGLEVEL:level}" }
        }

        date {
            match => ["timestamp", "yyyy-MM-dd HH:mm:ss,SSS"]
            target => "@timestamp"
        }
    }
}
output {
    if [fields][logtype] == "nginx_access" {
        elasticsearch {
            hosts => ["192.168.10.10:9200"]
            user => "elastic"
            password => "ElkPassword"
            action => "index"
            index => "nginx_access.log-%{+YYYY.MM.dd}"
        }
    }
    if [fields][logtype] == "nginx_error" {
        elasticsearch {
            hosts => ["192.168.10.10:9200"]
            user => "elastic"
            password => "ElkPassword"
            action => "index"
            index => "nginx_error.log-%{+YYYY.MM.dd}"
        }
    }
}
4、启动 logstash 服务
[root@localhost ~]# chown -R elk.elk /usr/local/logstash
[root@localhost ~]# su – elk
# 前台启动
[elk@localhost ~]$ /usr/local/logstash/bin/logstash -f /usr/local/logstash/conf/nginx.conf
# 后台启动
[elk@localhost ~]$ cd /usr/local/logstash/bin && nohup ./logstash -f /usr/local/logstash/config/nginx.conf >/dev/null 2>&1 &
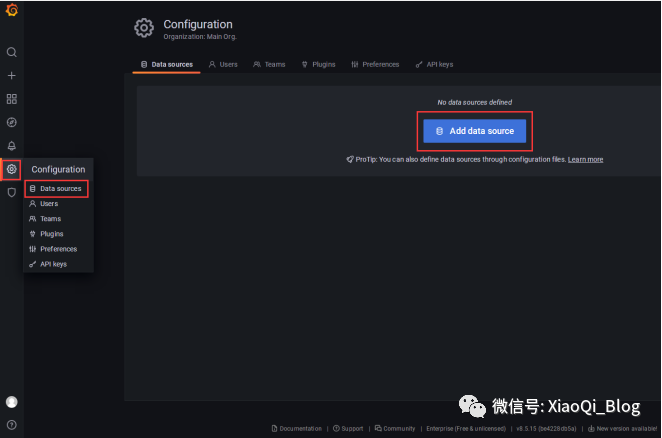
九、访问 Kibana
# 浏览器访问:http://192.168.10.10,出现如下界面

# 输入前面设置的用户名和密码,出现如下界面

# 选择自己浏览,出现以下界面


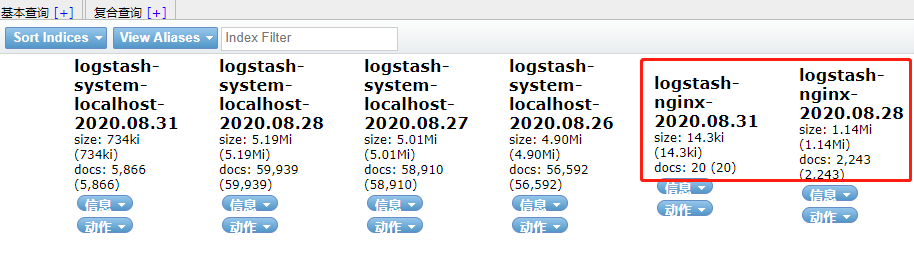
分别点击管理–》索引管理,这时候就能看到 Nginx 的索引信息

1)创建 Nginx 访问日志索引
索引模式—>>创建索引模式,输入索引模式名称,点击下一步


2)创建 Nginx 错误日志索引
索引模式—>>创建索引模式,输入索引模式名称,点击下一步


点击 Discover,就能看到日志数据了,如下图

至此,ELK 日志平台收集 Nginx 日志搭建完成。

![【学习强国】[挑战答题]带选项完整题库(2020年4月20日更新)-武穆逸仙](https://www.iwmyx.cn/wp-content/uploads/2019/12/timg-300x200.jpg)


![【学习强国】[新闻采编学习(记者证)]带选项完整题库(2019年11月1日更新)-武穆逸仙](https://www.iwmyx.cn/wp-content/uploads/2019/12/77ed36f4b18679ce54d4cebda306117e-300x200.jpg)


